
免费的性能提升!
分析方法
Benchmark
通过基准测试,我们可以测量一个函数的运行时间。还可以在运行测试时添加如-cpuprofile的参数,生成 profile 用于进一步分析。
func BenchmarkConvertReflect(b *testing.B) {
    var v interface{} = int32(64)
    for i := 0; i < b.N; i++ {
       f := reflect.ValueOf(v).Int()
       if f != int64(64) {
          b.Error("error")
       }
    }
}
$ go test -bench .                                                                                                                                                                             0ms
goos: windows
goarch: amd64
pkg: htmx-test
cpu: AMD Ryzen 5 4600U with Radeon Graphics
BenchmarkConvertReflect-12      528068373                2.118 ns/op
PASS
ok      htmx-test       1.388s
Profile
性能分析文件 profile 可以帮助我们分析程序在实际运行中,各种资源的使用的情况。
要获取 profile,可以在运行测试时添加如-cpuprofile的参数,也可以在运行时调用如pprof.StartCPUProfile的函数,常用的方法是在代码中引入net/http/pprof包,并启动一个 HTTP 服务,之后就可以访问http://ip:port/debug/pprof/获取想要的 profile 文件。
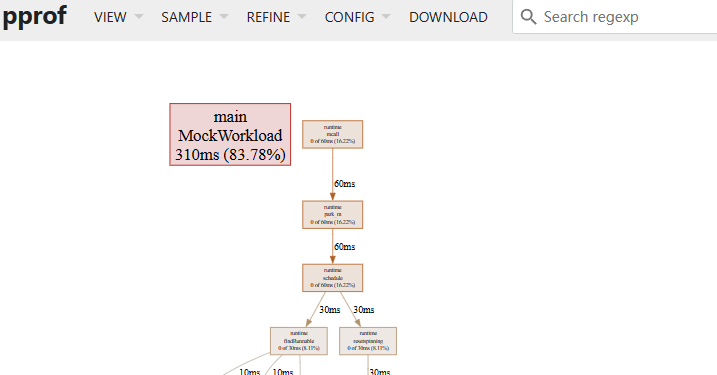
要分析 profile 文件,可以在命令行中运行go tool pprof <FILE>,添加-http参数还可以打开内置的 HTTP 服务,在网页中可视化查看分析结果。
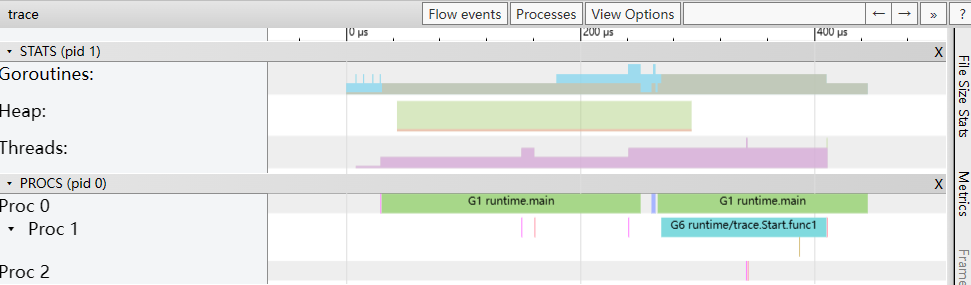
除此之外还有 trace 可用于分析:
curl -o trace.out http://ip:port/debug/pprof/trace?seconds=5
go tool trace trace.out
优化方法
数据
- 大量拼接字符串时使用
strings.Builder而不是+,通过空间预分配减少拷贝 - 创建切片、map 时可以指定预分配的容量,减少扩容次数
- 变量转变为 interface 时,内部会生成 iface 或 eface 结构,导致额外的空间分配和拷贝。类似情况的还有 reflect。性能要求较高时可以选择强类型,也可以试试泛型
- 循环中 range value 时,会在遍历前对整个容器进行拷贝,元素内存占用较大时可以选择容器中存储指针,或是在循环时 for index 和 range index
内存
在栈上的内存分配比堆要快得多,我们可以尽量避免变量逃逸到堆上,以提高性能。
可以在编译时添加-gcflags=-m查看变量逃逸的情况:
$ go build -gcflags=-m main_pointer.go
./main_pointer.go:10:6: can inline createDemo
./main_pointer.go:17:20: inlining call to createDemo
./main_pointer.go:18:13: inlining call to fmt.Println
./main_pointer.go:10:17: leaking param: name
./main_pointer.go:11:10: new(Demo) escapes to heap
./main_pointer.go:17:20: new(Demo) escapes to heap
./main_pointer.go:18:13: demo escapes to heap
./main_pointer.go:18:13: main []interface {} literal does not escape
./main_pointer.go:18:13: io.Writer(os.Stdout) escapes to heap
<autogenerated>:1: (*File).close .this does not escape
目前可能导致逃逸的情况有:
- 基于指针的逃逸
- 闭包
- 动态类型
- 栈空间不足
并发
- 对于临时对象,可以使用
sync.Pool保存和复用,减少内存分配和 GC 压力 - 在初始化中,可以使用
sync.Once代替init函数,需要时才运行
PGO
PGO(Profile-guided optimization)在 Go 1.21 中正式可用,这是一种基于代码的实际运行情况来引导编译器进行优化的方法。使用时,需要先获取 profile(参考前面的分析方法):
curl -o cpu.pprof "http://ip:port/debug/pprof/profile?seconds=30"
将该文件重命名为default.pgo并放在 main 包的目录下,编译时将会自动使用。我们可以使用go version -m <FILE>查看编译后的文件是否启用了 PGO。
一般情况下,这个方法可以带来 2% 到 7% 左右的提升。原理如下:
- 内联更多的函数
- 去虚拟化,将对接口的调用转换为
if f, ok := r.(*os.File); ok {f.Read(b)} else {r.Read(b)}的形式,让编译器能进一步优化它
参考
Go 语言高性能编程 | 极客兔兔 (geektutu.com)
Go 语言设计与实现 | Go 语言设计与实现 (draveness.me)
A Guide to the Go Garbage Collector - The Go Programming Language (golang.org)
Profile-guided optimization in Go 1.21 - The Go Programming Language